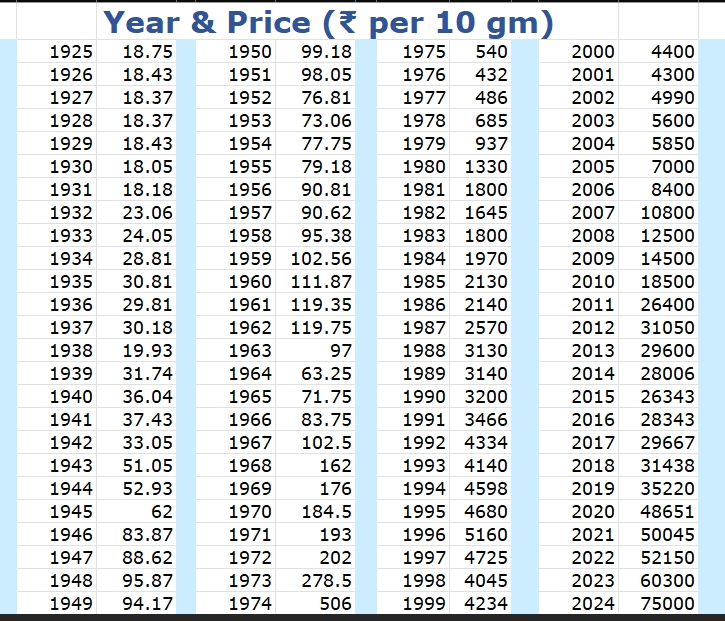
Let’s analyze the data to identify any significant bear rallies (prolonged periods of price decline or stagnation) in the Indian gold market from 1925 to 2011.
Upon a detailed review of the data, there are no classical, prolonged “bear rallies” (more accurately called bear markets) spanning 5-10 years where the price consistently fell. Gold in India has had an overwhelmingly strong long-term bull trend, especially after the gold standard was abandoned.
However, we can identify three distinct periods of significant price correction or stagnation that stand out. These are the closest approximations to a “bear rally” in this dataset.
1. The Post-WWII Stagnation (1947 – 1961) – ~14 Years
This is the clearest and longest period of bearish activity.
- Duration: 14 years (from 1947 to 1961)
- Peak (1947): ₹88.62
- Subsequent Trough (1953): ₹73.06
- Analysis: After a massive rally during and right after WWII (₹18 in 1939 to ₹88.62 in 1947), the price entered a long phase of stagnation and decline. It fell for six years and didn’t decisively break above its 1947 high until 1961 (₹119.35). When adjusted for inflation, this was a very significant bear market. The price in 1961 was only ~35% higher than in 1947, a poor return over 14 years.
2. The Mid-1960s Correction (1964 – 1968) – ~4 Years
This is a shorter but sharp correction within a larger bull market.
- Duration: 4 years (from the end of 1963 to the end of 1967)
- Peak (1963): ₹97
- Trough (1964): ₹63.25 (a 35% drop)
- Analysis: This was a sharp, swift bear rally. The price crashed from ₹97 to ₹63.25 in a single year. It then took four years of rallying to not only recover but make a new high (₹162 in 1968). While the downturn was sharp, the recovery was relatively quick, so it doesn’t qualify as a prolonged 5-10 year bear market.
3. The Late 1990s Stagnation (1996 – 2001) – ~5 Years
This is the best example of a modern-era bear rally/stagnation.
- Duration: 5 years (from 1996 to 2001)
- Peak (1996): ₹5,160
- Subsequent Trough (1998): ₹4,045 (a 22% drop)
- Analysis: After a strong run-up in the early 90s, the price peaked in 1996. It then fell for two years and traded in a tight, stagnant range between ~₹4,000 and ₹4,700 for five years. The price in 2001 (₹4,300) was still lower than the 1996 price. This period of consolidation was followed by the massive, historic bull run that started in 2002.
Conclusion
There are no major 5-10 year periods where the price consistently fell year after year. Gold’s long-term trend in India has been decisively upward.
However, the three periods identified above, particularly the 14-year stagnation from 1947-1961 and the 5-year stagnation from 1996-2001, are the definitive “bear rallies” in an otherwise relentless bull market. These were periods where investors who bought at the peak would have seen negative or flat returns for a very long time.
Key Takeaway: The most important lesson from this data is that while gold is an excellent long-term store of value, it can and has experienced periods of significant stagnation and drawdown that can last for many years.